Summary#
The factors table is a summary view of your map: it tells you which factors are most prominent in the current view of the data, and how that changes across groups.
- Input: the current (already filtered) links table.
- Output: one row per factor label, with counts and optional breakdowns.
The key idea: everything starts from links. The factors table is derived from them.
When to use it#
- Orientation: “what are people talking about most?”
- Role reading: “which factors mainly show up as outcomes vs causes?”
- Comparison: “what differs by group/context?”
What the counts actually mean#
The factors table is built from “factor mentions” that come from links:
- each link contributes a cause mention and an effect mention
- totals therefore count mentions, not “number of links”
Two useful evidence units:
- Sources = how widely shared (distinct sources)
- Citations = how often said (coded claims; sensitive to verbose sources)
Typical views people use#
1) Overall prominence#
Sort by Source count or Citation count to find the “main” factors in the current view.
2) Causes vs outcomes#
Split counts into:
- out (“as a cause”)
- in (“as an effect”)
This helps you read whether a factor is mostly described as a driver, an outcome, or both.
3) Group breakdowns (comparisons)#
If your sources have metadata (e.g. district, gender, age band), you can break the table down by group to ask:
- “which factors are disproportionately mentioned by group A vs group B?”
- “which outcomes differ by context?”
4) Normalised (percent) views#
Normalisation is for fair comparison when groups differ in:
- number of sources, or
- overall verbosity.
In practice: percent views are about relative prominence, not absolute volume.
5) Significance tests (optional)#
If you choose exactly one grouping variable, the app can highlight factors where the group differences are unlikely to be just “baseline group size” effects.
Use these as attention guides, not as definitive proof: always go back to quotes/links to interpret what the difference actually is.
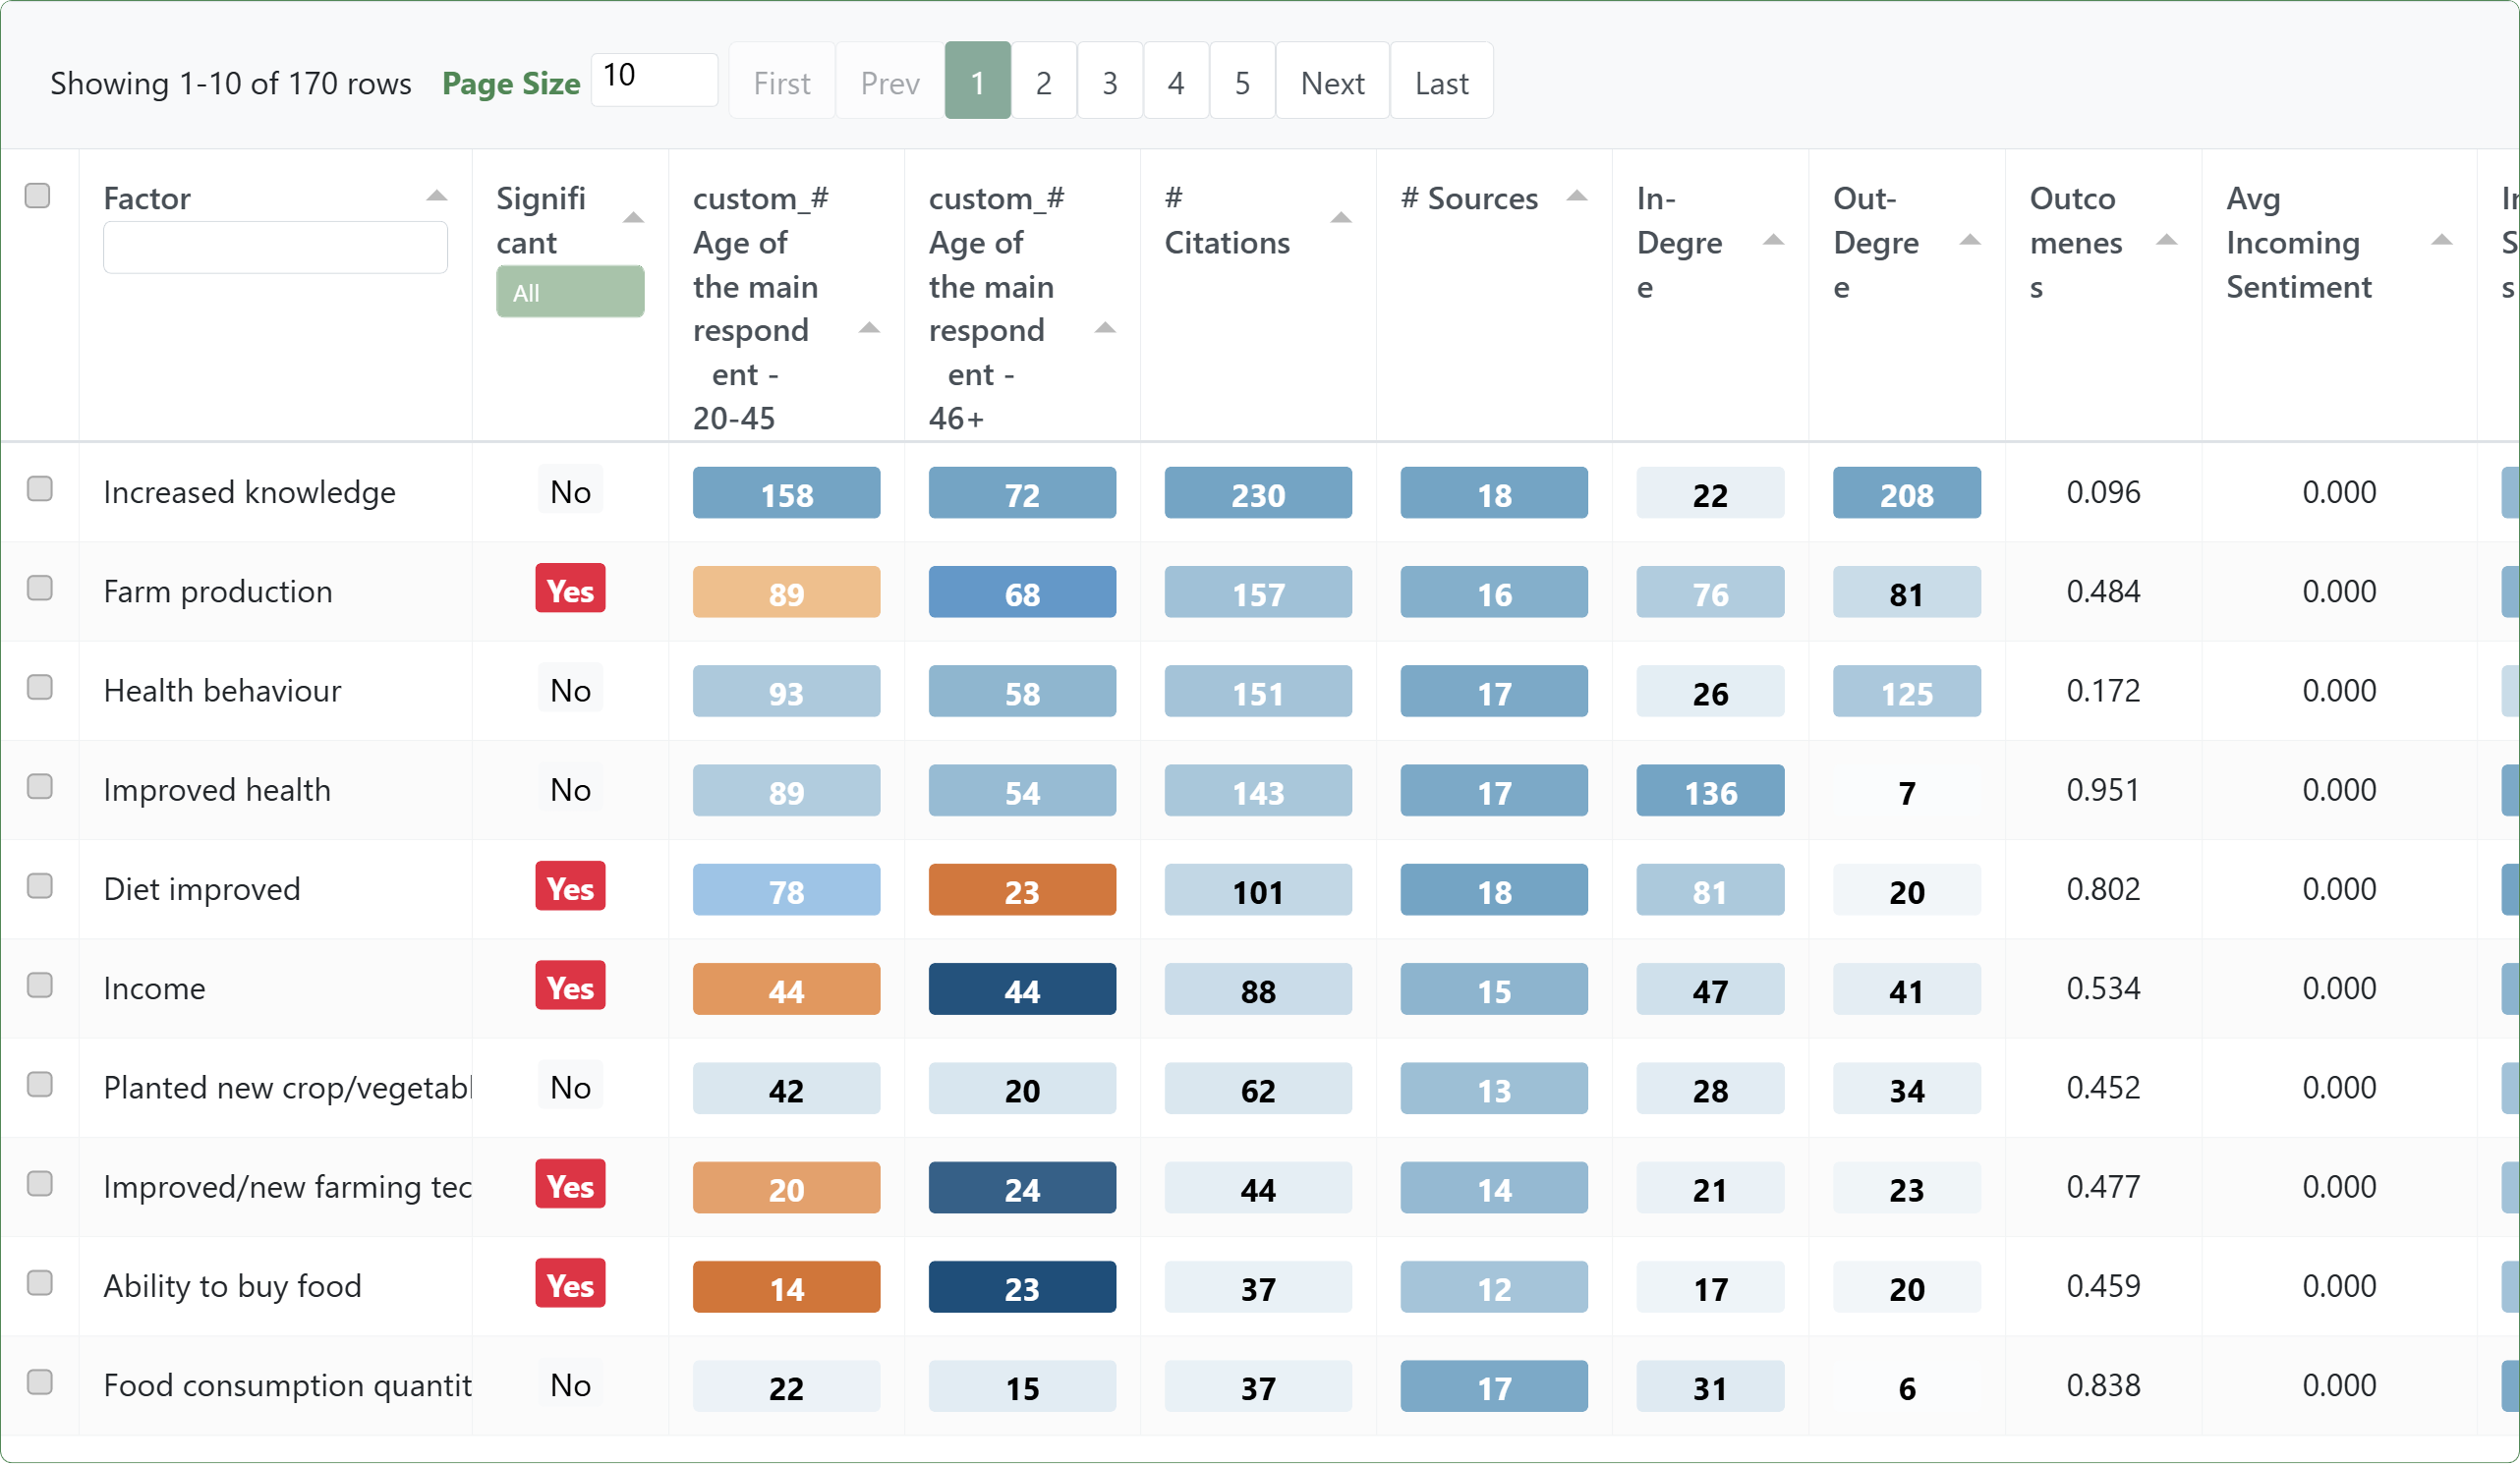
Examples (from the app)#
Factors table: group differences + tests#
Bookmark #535
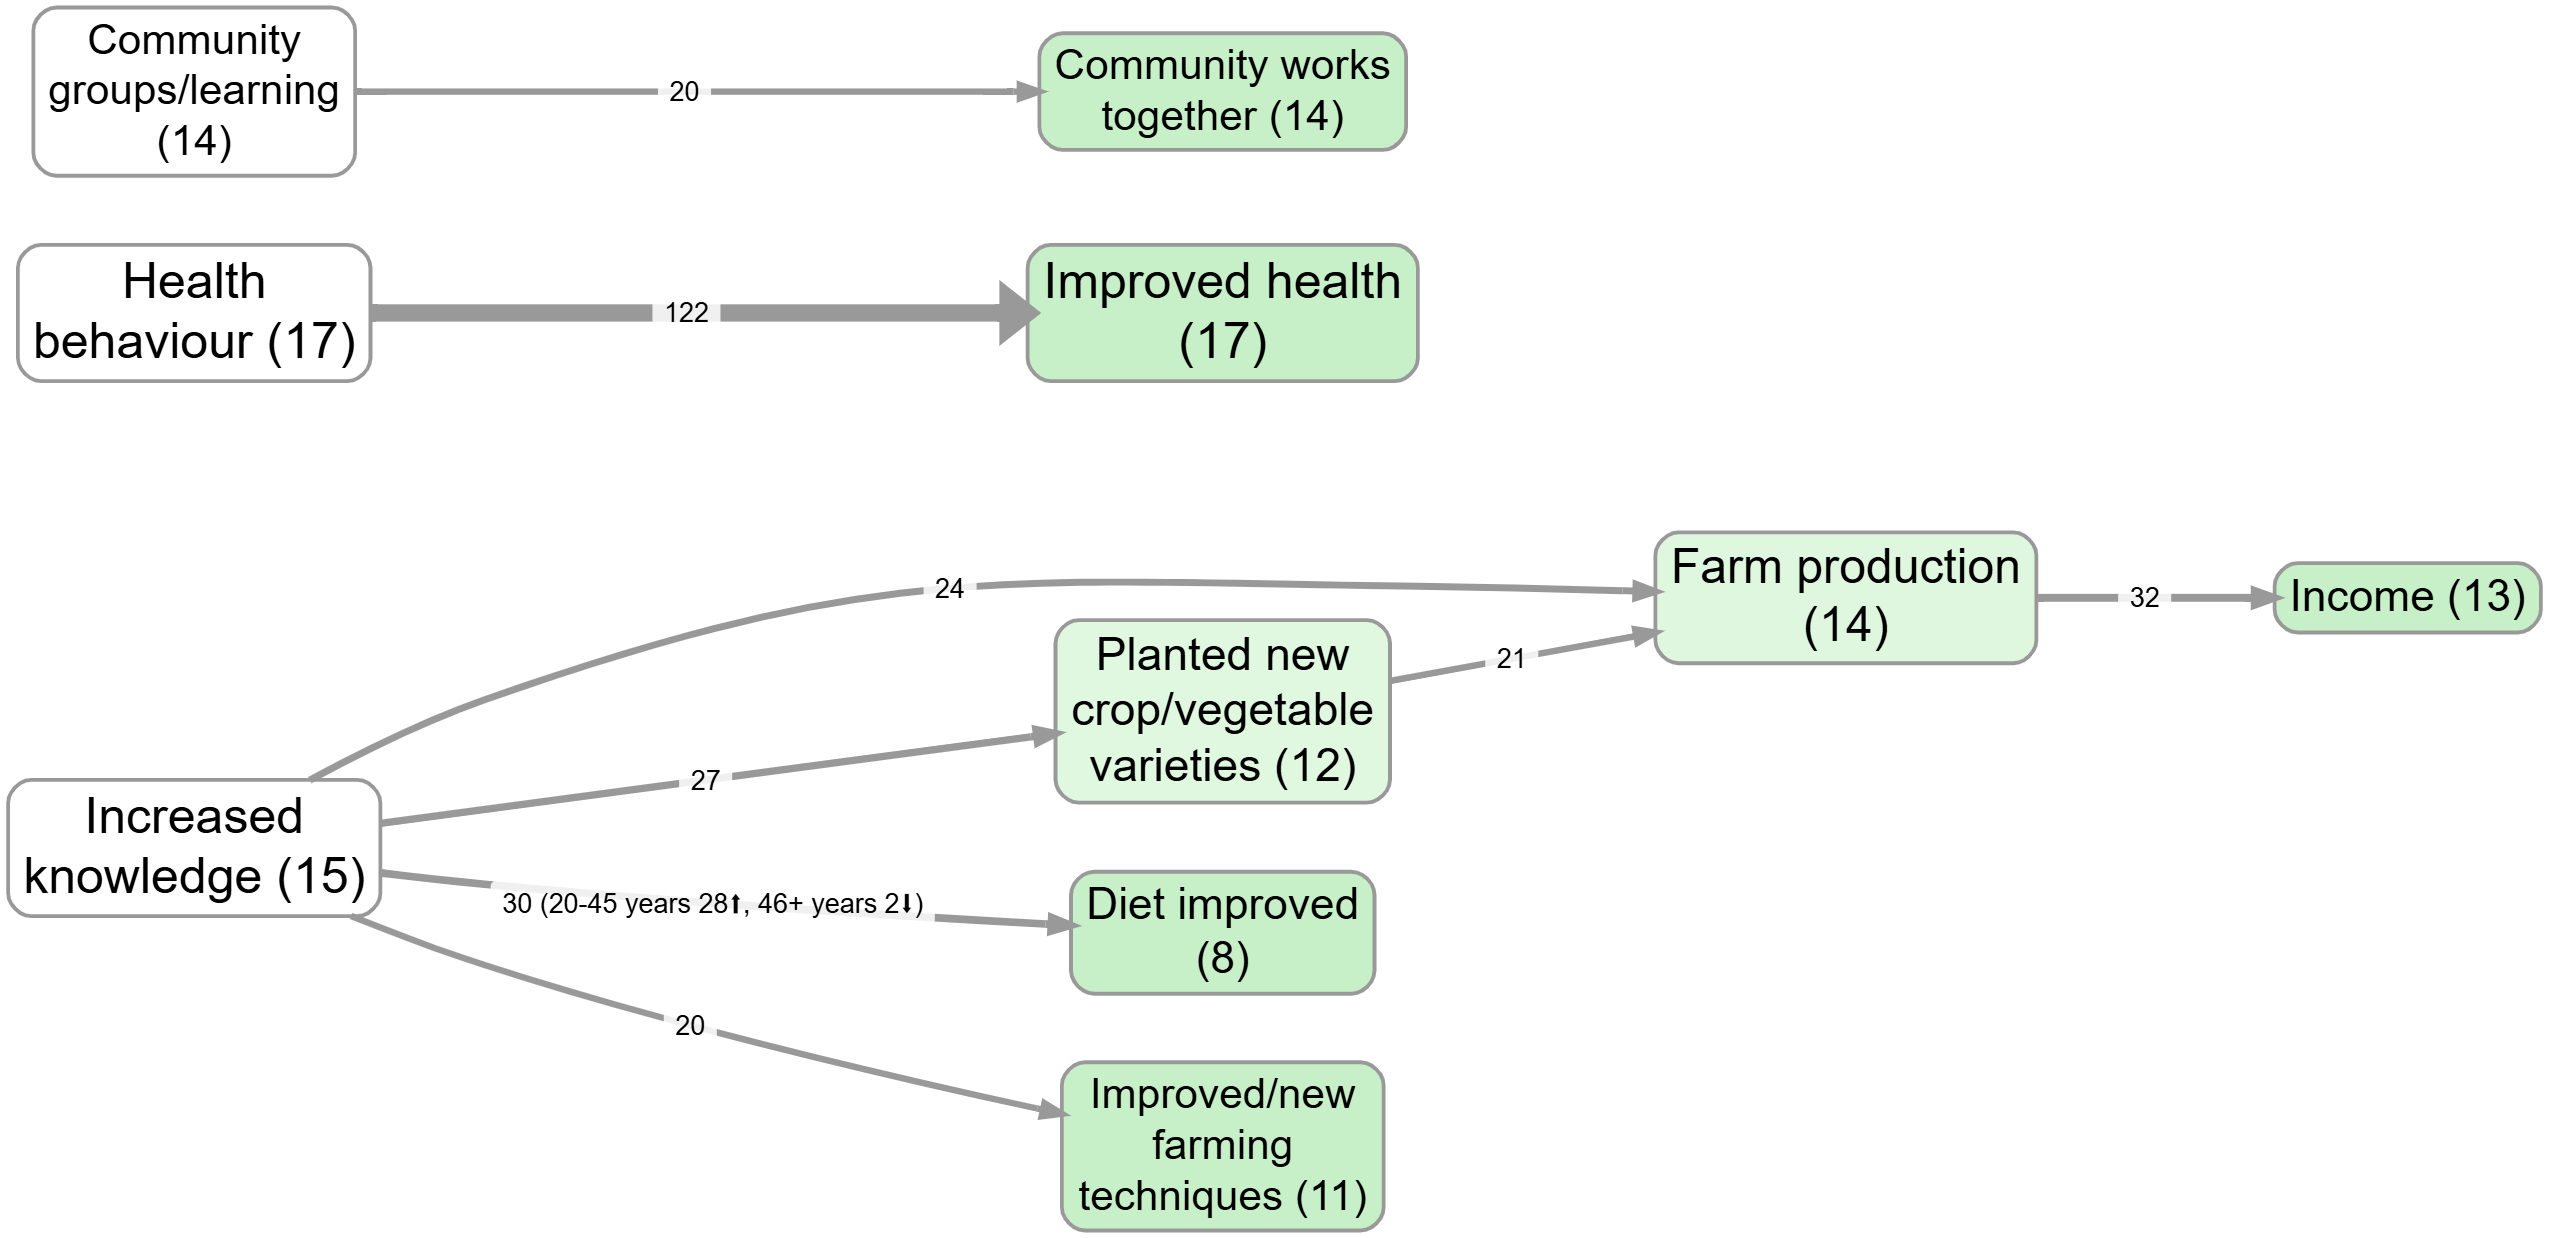
Bringing group differences onto the map (as link labels)#
Bookmark #980
Formal notes (optional)#
If you want the precise construction, here it is.
Factor mentions
Each link row contains a cause label, an effect label, and a source_id. From each link row we derive two mention records:
- one mention for the cause label (direction =
out) - one mention for the effect label (direction =
in)
These mention records are the atomic units that the factors table aggregates. This is why totals across factors are totals of mentions (each link yields at least two mentions).
Label rewrites
Before aggregating, apply any label-rewrite transforms (collapse, remove bracket text, etc.). These are temporary rewrites for analysis/presentation; they do not change the underlying coding.
Group breakdown cells
If \(G\) is a grouping variable on sources (e.g. district), a cell can be computed in citations-mode or sources-mode:
- citations mode counts mention records in that cell
- sources mode counts distinct sources that contribute at least one mention in that cell
Percent-of-baseline intuition
\[ \text{share}(f,g) = \frac{\text{cell}(f,g)}{\sum_{f'} \text{cell}(f',g)} \]
Significance tests (intuition)
Even if group A has more mentions overall than group B, a per-factor test asks whether factor \(f\) is still over-represented in one group relative to those baselines.